What is horizontal line and how to draw horizontal line
What is horizontal line and how to draw horizontal line
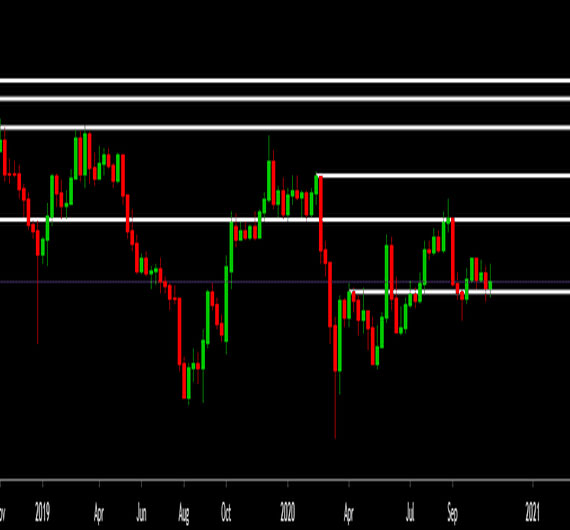
It's common practice to indicate a price with horizontal lines. They are also a great tool for checking off support and resistance levels. Horizontal lines are drawn in a single direction and continue indefinitely, much like Extended lines, which can be drawn in any direction. A move below the horizontal support line can portend more price drops, but if the support holds and the price rises, more price increases might be on the horizon. A horizontal line of resistance follows the same rules. Higher prices may be in the horizon if the price breaks above resistance. The horizontal line has held, and traders will be on the lookout for lower prices if the price reaches resistance and then begins to collapse. Put more simply, the point where the numbers on the y-axis are equal on a chart is called a horizontal line. A data point rising above the horizontal line would suggest a rise in the y-axis value over recent values in the data sample if it has been drawn to depict a succession of highs in the data.
© 2024 Forex Trading Training, All Rights Reserved
Designed & Developed By
![]()